
WHY THE LOWEST O&M BUDGET IS RARELY THE MOST PROFITABLE
By: Robert Wolfe, Director of Asset Optimization, NAES
Executive Summary. O&M budgets should be evaluated by the operating margin they enable, not by cost adherence alone. The optimal investment level balances reliability, performance, risk, and commercial obligations. NAES Asset Solutions helps owners identify that level through normalized benchmarking, operating margin analysis, staffing and contractor review, outage and long-term service agreement (LTSA) evaluation, and remaining useful life assessment, then converts the findings into an actionable asset management plan.
Power plant O&M is often managed as a budget-control exercise: the plant receives an annual target, the team works to stay within it, and performance is measured by budget adherence. This approach satisfies annual planning requirements, but it can obscure the more important question, whether the level and allocation of O&M investment maximize operating margin. For most generating assets, the real question is not whether O&M spending is “high” or “low.” The real question is whether the current level and allocation of O&M investment produce the highest achievable operating margin for the asset technology, market position, age, risk profile, and commercial obligations.
At NAES, we see this issue across conventional, renewable, industrial, and cogeneration assets. Insufficient investment exposes owners to forced outages, derates, degraded heat rate, compliance risk, and accelerated equipment deterioration. Excessive or poorly allocated spending reduces operating margin through inefficient contractor use, staffing models that do not match the operating profile, underperforming LTSAs, and preventive maintenance programs that are not risk-ranked. The economic optimum is usually somewhere between those two extremes. The goal is to maximize operating margin, not simply minimize O&M costs.
NAES Asset Solutions treats O&M optimization as an integrated financial, operational, and reliability challenge. Its Financial Solutions methodology combines fixed and variable O&M benchmarking, engineering and capital estimates to extend remaining useful life, operating margin analysis, staffing and contractor review, outage strategy, and LTSA evaluation. The result is an asset management plan that defines the actions required to move the facility from its current state toward the economically optimal state.
THE COMMON MISTAKE: MANAGING O&M TO THE BUDGET
INSTEAD OF THE OPERATING MARGIN
FAILURE MODE 1: UNDERSPENDING
When O&M investment falls below the level required by the assets’ commercial and reliability obligations, cost is not eliminated; it is shifted into lost revenue, corrective maintenance, degraded performance, and future capital exposure. The resulting opportunity costs commonly appear as:
- Forced outages
- Higher rates of corrective maintenance
- Increased heat rate
- Derates and lost capacity
- Increased outage discovery & longer planned outages
Planned costs are managed in the short term while risk and opportunity costs are transferred to future operating periods. Ultimately, deferred risk results in derates, longer planned outages, and more unplanned outages.
FAILURE MODE 2: OVERSPENDING
Some plants spend heavily with the intent to align reliability with operating constraints, but the investments are misallocated, and the reliability is not realized. Common indicators include:
- Ineffective contractor supervision and scope definition
- Staffing levels misaligned with operating profile and contractor support
- Preventive maintenance that is not risk-ranked
- LTSA performance not aligned with optimal outage durations
- Outage spending that does not reduce repeat failure modes
- Weak computerized maintenance management system (CMMS) data integrity
- Maintenance activity that is not tied to critical equipment consequence
- Fixed costs that don’t match dispatch economics
Financial benchmarking provides a metric system for identifying spending that does not produce a corresponding improvement in reliability, performance, or operating margin.
UNDERSTANDING THE OPERATING MARGIN CURVE
The operating margin curve provides a practical link connecting plant spending, plant performance, and financial performance. For purposes of asset optimization, this article uses Operating Margin in a broad asset-management sense that incorporates the sustaining capital required to support the desired reliability level.
Operating Margin = Revenue – Fuel – Variable O&M – Fixed O&M – Sustaining Capital
When O&M investment is too low, forced outage risk rises and availability falls. Heat rate may degrade. Revenue opportunity is lost. In merchant or partially merchant environments, this can be especially damaging because unavailable capacity often coincides with high-value market windows.
When O&M investment is too high, costs increase faster than reliability improves. Additional spending yields diminishing returns. The plant may become more expensive without significant gains in availability, reliability, dispatchability, or operating margin.
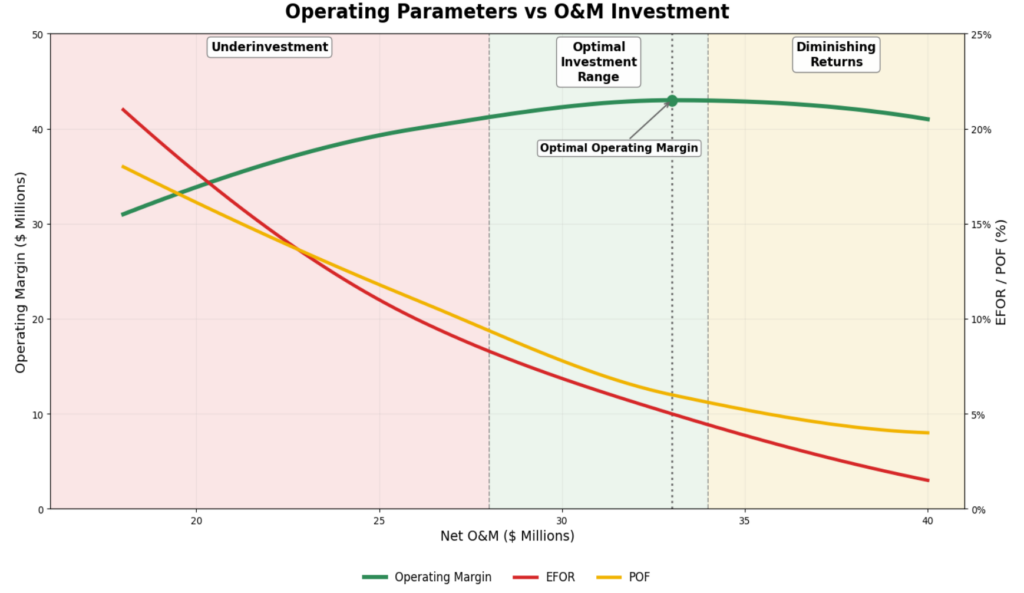
The optimal O&M investment strategy lies between these conditions, and it is not theoretical; it can be estimated through disciplined analysis:
- Normalize and benchmark the plant’s fixed and variable O&M costs
- Compare performance against best practice for similar technology
- Identify the relationship between O&M investment and operating margin
- Analyze reliability-critical spending categories and flag potential inefficient spending
- Quantify where additional O&M investment produces diminishing returns
- Build an asset management plan to close the gap
Incremental O&M investment is economically justified when: Expected reduction in lost margin + avoided corrective cost + avoided capital exposure > incremental O&M cost.
This analysis combines a normalized fixed and variable O&M model with comparable-technology benchmarks and operating experience. It then evaluates staffing, contracted services, fixed-to-variable cost ratios, outage strategy, LTSA performance, and sustaining capital requirements to define the investment level most likely to maximize operating margin.
BENCHMARKING AGAINST SIMILAR ASSETS
Benchmarking makes the conversation actionable. A plant cannot determine whether it is overspending or underspending by looking only at its own budget history. Prior-year spending is a record of past performance; it is not a benchmark for optimizing asset value.
NAES evaluates O&M cost and performance against comparable assets, technology classes, operating regimes, and commercial structures. The objective is not to force every plant into an average but rather to identify whether the facility’s cost structure, reliability, performance, and risk position are aligned and economically rational. An accurate benchmark must normalize for technology, duty cycle, commercial structure, asset age, remaining useful life, site configuration, and regional cost conditions. A circulating fluidized bed coal unit, for example, has a different financial risk and reward profile from a combined cycle gas turbine facility. Likewise, a steam-host cogeneration facility operates under different constraints from a merchant generator, and a 60-year-old coal facility planning seven additional years of operation will have different optimal EFOR and operating margin targets from a 20-year-old combined cycle facility.
KEY BENCHMARK CATEGORIES INCLUDE:
SITE-SPECIFIC OCM COST FACTORS
The facility O&M budget is compared to NAES’ operating experience and industry data for similar assets. As a starting point there is an expected cost range. Site and industry specific factors are considered. A coal facility with barge offloading and a high maintenance canal may have higher costs than a facility with rail offloading. Labor costs are higher in some regions than others. Equipment remaining useful life will also impact how facilities are compared for benchmarking purposes.
SITE-SPECIFIC EǪUIVALENT FORCED OUTAGE RATE (EFOR) CONSIDERATIONS
EFOR reflects the combined effects of organizational effectiveness, maintenance processes, and equipment condition. After normalizing for organizational and process factors, the analysis estimates the equipment investment required to achieve the reliability level that maximizes operating margin. A 60-year-old coal facility planning seven more years of operation may economically target an EFOR of 6%, while a 25-year-old combined cycle gas turbine facility may justify a 1% target. The appropriate target is therefore modeled against investment requirements, remaining useful life, commercial obligations, and expected margin improvement.
STAFFING
The key question is not whether staffing is “lean” or “heavy,” but whether the staffing model supports the asset’s operating profile, regulatory obligations, outage execution, and reliability requirements. The balance between base staff and contractor strategy also needs to support the asset’s operating profile and that balance needs to be customized for every facility.
LTSA STRATEGY
Long-term service agreements (LTSAs) and maintenance service agreements (MSAs) can be effective ways to manage equipment maintenance, but they can also become economically inefficient if scope, operating assumptions, outage intervals, or commercial terms do not align with the asset’s actual operating profile. Vendor-management tools and strategy, including planned-outage reduction and execution quality-assurance methods, can result in weeks per year of additional operating revenue.
CONTRACTED SERVICES
Contractors can reduce operating costs when they perform variable work that does not justify full-time staffing or fixed work where scale creates an economic advantage. An unmanaged dependency, however, can inflate fixed and variable O&M, weaken accountability, and extend outage durations. NAES benchmarks contractor performance and commodity-level costs to identify opportunities to reduce spending and strengthen LTSA and MSA accountability. In some cases, total O&M costs, including contracted services, have reached twice the benchmark; targeted vendor-management controls and organizational changes can help close both cost and performance gaps.
OUTAGE SPENDING
Outage cost must be evaluated against outage duration, critical path discipline, discovery work, post-outage reliability, and the market value of returning sooner. NAES’s outage services approach emphasizes readiness reviews, scope validation, contractor capability to execute, integrated Level 3 scheduling, budget tracking, contingency planning, risk management, and commissioning discipline.
FIXED VS. VARIABLE COST RATIOS
A plant’s cost structure should support how the asset generates revenue. Higher fixed costs relative to variable costs may indicate an opportunity to execute work more efficiently during outage windows. Higher fixed costs may also simply indicate that Contracted Services or another part of the fixed budget should be managed differently.
NAES uses benchmarking and fixed-to-variable ratios to model changes that decrease opportunity costs and increase operating margin.
THE COST YOU DON’T SEE IN THE OCM BUDGET
A budget captures reported spending, but it does not capture every economic consequence of the maintenance strategy. Operating margin, as used in this article, comprehensively considers:
Reported O&M Cost +
Expected lost margin from forced outages and derates + Heat-rate degradation +
Extended planned-outage duration + Corrective-maintenance premium + Accelerated capital consumption =
True Economic Cost of the Maintenance Strategy
CASE STUDIES: TWO DIFFERENT WAYS TO MISS THE OPTIMUM
CASE A: HIGH SPEND, UNACCEPTABLE RELIABILITY
In one anonymized combined-cycle assessment, the facility was spending approximately 2X the industry norm while operating with 6% EFOR. This combination of high spending and relatively low reliability warrants an immediate review of both cost allocation and maintenance effectiveness. The analysis should determine whether resources are directed toward the failure modes and equipment risks that most affect EFOR, outage duration, derates, heat rate, and return-to-service performance.
- Maintenance effectiveness — Are PM and predictive-maintenance activities addressing the failure modes that drive EFOR and derates?
- Contractor effectiveness — Is contractor performance measured against cost, quality, schedule, and return-to-service results? Are contractor crew sizes drifting higher while durations are increasing without changes in scope?
- Asset condition — Are aging equipment, single-point failures, spares, redundancy, and remaining useful life creating disproportionate risk?
- Outage and LTSA performance — Are outage duration, repeat defects, and LTSA economics aligned with the actual operating profile? Are LTSA providers focused on planned outage duration?
- Organization and process — Are staffing, CMMS data quality, event response, work identification, and accountability supporting the required reliability level?
The resulting roadmap combines targeted spending reductions, stronger LTSA and contractor accountability, and redirected resources toward the risks that drive forced outages, post-outage return-to-service delays, derates, and heat-rate degradation.
CASE B: LOW SPEND, UNSUSTAINABLE RELIABILITY
In another anonymized case, a coal facility nearing retirement was spending 25% below the industry norm and experiencing 40% EFOR. The owner was considering a 10-year extension, and some capital equipment was nearing the end of remaining useful life. In this case, the reliability level was clearly misaligned with the trading and revenue strategy. Component assessment and engineering evaluations were needed to understand Remaining Useful Life (RUL). The decision required an integrated view of annual O&M, capital investment, equipment condition, remaining useful life, and the reliability level needed to maximize operating margin.
Key point: Low O&M cost was not evidence of efficient operations. Cost had migrated from the O&M budget into lost generation, asset deterioration, and future capital requirements.
Again, data are used to quantify a path forward. In addition to the annual O&M spending and reliability questions in Case A, capital spending must be estimated to align equipment condition with the reliability required to optimize operating margin.
- What maintenance has been deferred?
- Is the plant under-resourced for its reliability obligation?
- What capital or major maintenance work must be executed to align EFOR with operating margin?
- What capital equipment is nearing the end of remaining useful life?
- How much is heat rate affecting revenue and operating margin?
A risk matrix is developed from the site condition assessment and engineering recommendations. The purpose is to translate equipment condition into decision-ready information: outage exposure, cost of failure, mitigation actions, mitigation cost, and implementation priority.
| Asset | Condition / Risk | OOS Exposure | Cost of Failure | Recommended Mitigation | Mitigation Cost |
|---|---|---|---|---|---|
| U3 GSU | Oil leak; electrical testing past due; gas buildup indicated in oil samples. | 400 hr | $3.64M | Resample and complete electrical testing / leak evaluation. | $0.05M |
| U3 HP Turbine | Major inspection past due; crack identified in Row 2 stationary blade. | 4,500 hr | $38.45M | Major inspection and contingency parts. | $1.70M |
| U2 Generator | Medium inspection past due based on estimated operating hours. | 4,500 hr | $33.45M | Complete medium inspection. | $0.95M |
| U3 Boiler | Creep exposure requiring pressure-part remediation. | 650 hr | $4.92M | Pressure-part replacement / creep remediation. | $2.00M |
Illustrative excerpt only. Detailed engineering risk registers may also include likelihood, consequence, difficulty to resolve, implementation timeframe, $/hour exposure, and complete repair cost.
BUILDING THE ROADMAP: FROM CURRENT STATE TO OPTIMAL STATE
Once the current state is benchmarked, implementation begins with a facility-specific roadmap that converts findings into an executable asset-management strategy. At a minimum, the roadmap aligns organization and staffing, contracted services, fixed and variable costs, outage planning, LTSA performance, capital requirements, accounting structure, and asset-management priorities with the owner’s commercial objectives.

1. ORGANIZATION AND STAFFING PLAN
Align the staffing model with the asset’s actual operating profile, including operations coverage, maintenance capability, planning and scheduling, compliance support, outage readiness, and leadership structure. The staffing plan should distinguish between permanent capabilities and specialized support best provided by third-party resources.
2. CONTRACTED SERVICES AND CONTRACTOR STRATEGY
Contractor spending should be segmented primarily by commodity, fixed or outage (variable), and specialty or emergency support. The goal is to reduce overspending on contracted services while retaining access to specialized skills where they add value. In an anonymized coal-facility life-extension assessment where overspending was a primary concern, NAES identified contracted services as the largest O&M cost-reduction opportunity, representing approximately 40% of forecast spend (roughly 1.3X expected).
3. FIXED VS. VARIABLE COST AND OUTAGE PLANNING
Outage strategy should align with market value, forced outage exposure, critical path execution, and post-outage reliability. The outage plan should define scope, contractor capability, schedule and budget risks, contingency planning, quality surveillance, and commissioning requirements before the outage begins. Outage planning is a revenue protection exercise. Variable contract services must be leveraged to minimize outage windows, manage costs, and improve reliability.
4. LTSA RISK MITIGATION AND PERFORMANCE
The LTSA must be evaluated against current operating conditions. Starts, hours, dispatch profile, heat rate, parts strategy, outage intervals, cash flows, and commercial terms should all be reviewed. Installing processes and training to manage execution and prevent return-to-service errors is often a relatively accessible improvement opportunity. These changes do not necessarily require changing the contract. Like outage planning, managing LTSA performance to defined metrics and processes is a revenue-protection exercise.
5. CAPITAL CONSIDERATIONS AND REMAINING USEFUL LIFE
At some point, the remaining useful life of equipment will affect heat rate and reliability, creating an opportunity cost that exceeds the cost of equipment replacement. Aligning reliability with trading and revenue strategy is critical. NAES can provide a basis for making these decisions through a physical condition assessment and engineering overview that develops budgetary estimates and recommendations.
6. ACCOUNTING STRUCTURE
In some cases, the existing general ledger (GL) structure prevents owners from understanding costs and improving facility operations. As part of the benchmarking exercise, NAES reviews the budget in detail and can recommend changes to the GL structure when expenses are commingled across facilities or similar services are recorded in inconsistent cost categories. At one facility, costs were mixed across multiple generating plants and unrelated manufacturing processes. Separating and normalizing power-production costs from other activities created the cost visibility needed for meaningful benchmarking and operating decisions.
7. ASSET MANAGEMENT PLAN
The final roadmap must integrate reliability, O&M cost, capital investment, engineering, accounting, compliance, and commercial objectives into a unified decision framework. This is where plant-level detail is converted into owner-level investment decisions.
- Depending on the facility, financial benchmarking and remaining useful life condition assessments can be combined with Risk & Reliability and Operational Excellence Reviews to address specific performance gaps.
- NAES has used this integrated approach at multiple coal facilities to support life-extension decisions and at combined-cycle facilities to clarify risk and operating-efficiency opportunities.
- In one anonymized cogeneration assessment, variable O&M costs were 44% above comparable assets and fixed costs were 133% above industry experience, approximately $33 million per year above expected levels. These values are site-specific and are presented as an example of the magnitude of opportunity that benchmarking can reveal.
The value of the analysis is not the benchmark itself. It is the ability to convert financial, operational, and engineering information into an asset-specific investment strategy that ownership can defend.
THE TAKEAWAY
Every generating facility has an economically optimal level and allocation of O&M investment.
The objective is not to minimize O&M spending. The objective is to determine the level and allocation of O&M and sustaining capital investment that maximize operating margin.
Reaching this point requires benchmarking, normalization, reliability analysis, outage discipline, LTSA review, staffing evaluation, contracted-services review, and a financial model that links plant decisions to owner outcomes.
A disciplined asset-optimization process moves the discussion beyond annual budget targets toward a defensible, data-driven investment strategy. Fleet-informed benchmarking, fixed and variable O&M analysis, outage planning, LTSA review, staffing evaluation, contractor strategy, engineering assessment, and asset-management planning together identify where an asset is overinvested, underinvested, or misaligned with its commercial objectives.
To benchmark your facility’s current O&M cost curve, quantify the operating margin opportunity, and build a roadmap from current performance to the optimal state, contact me at Rob.Wolfe@NAES.com.